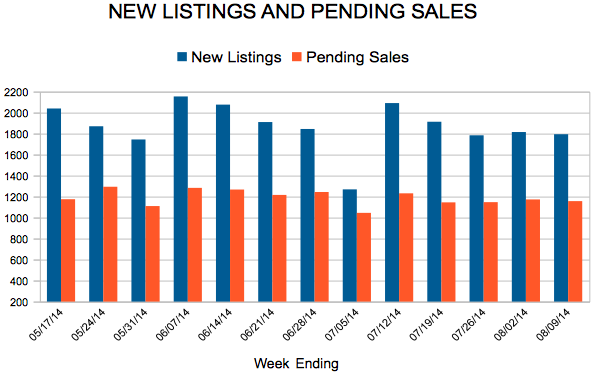
New Listings and Pending Sales
Where has the Twin Cities real estate market been and where is it heading? This monthly summary provides an overview of current trends and projections for future activity. Narrated by Cotty Lowry (2014 Treasurer, Minneapolis Area Association of REALTORS®), video produced by Chelsie Lopez.

Decreased supply, strong demand and higher prices are among the encouraging developments in 2012 that make the case for continued recovery in 2013. Consumer purchase demand increased organically, absent any government incentives. As the active supply of homes for sale fell to 10-year lows, absorption rates improved to levels also not seen since 2003. Multi-decade low interest rates and record housing affordability resulted in a 16.9 percent increase in home sales for the 13-county metro.
2012 by the Numbers
• Sellers listed 65,914 new homes on the market, a modest 4.3 percent decrease from 2011 and a 10-year low.
• Buyers purchased 48,641 homes, up 16.9 percent from 2011 and the highest figure since 2006 (783 units shy).
• Inventory levels dropped 31.8 percent from 2011 to 11,875 units, the lowest level in 10 years.
• Months Supply of Inventory dropped 42.2 percent to 2.9 months.
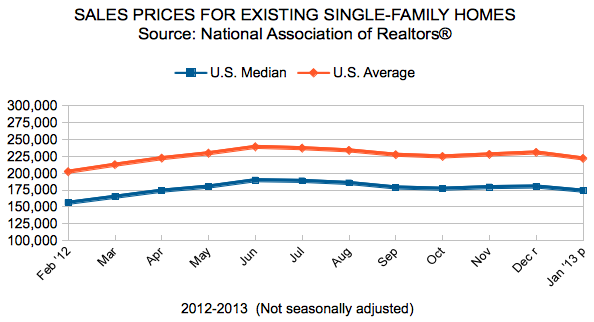
• The Median Sales Price of closed sales was up, rising 11.9 percent to $167,900.
• Cumulative Days on Market was down 20.6 percent to 117 days, on average.
• Lender-mediated properties made up a smaller share of overall activity
• 34.6 percent of all New Listings were lender-mediated (either foreclosures or short sales), down from 41.9 percent in 2011 and 42.6 percent in 2010
• 37.3 percent of all Inventory was lender-mediated, down from 44.4 percent in 2011 and 47.4 percent in 2010
• 39.7 percent of all Closed Sales were lender-mediated, down from 50.0 percent in 2011 and 47.9 percent in 2010

On Dec. 13, Freddie Mac’s Primary Mortgage Market Survey® (PMMS®) results showed fixed mortgage rates easing slightly and remaining near record lows.
The housing market is improving. But don’t take our word for it. CoreLogic, Standard & Poor’s, FHFA and the NAHB all closely monitor a diverse array of housing data and indicators. At some point over the past six months, every single one of these indices has either reached a multi-year high or has shown several consecutive months of improvements. Does that mean every home in every neighborhood in every city across America is worth more today than it was a year ago? Of course not. But you’d be surprised just how robust this recovery is. Go ahead, dig into the numbers and see for yourself.
In the Twin Cities region, for the week ending October 20:
- New Listings increased 0.6% to 1,110
- Pending Sales increased 33.3% to 1,012
- Inventory decreased 28.5% to 15,903
For the month of September:
- Median Sales Price increased 12.8% to $174,813
- Days on Market decreased 28.5% to 101
- Percent of Original List Price Received increased 4.0% to 94.8%
- Months Supply of Inventory decreased 39.2% to 4.1
Housing pessimism is as out of fashion nowadays as bell bottoms and shoulder pads. Those who are still fishing for that elusive “market bottom” have likely missed it in most areas. The major story continues to be tightened inventory and high buyer turnout. Homes should be selling faster and for closer to list price – or even above in the hottest neighborhoods. Continue to monitor key differences between the foreclosure and traditional segments as well as variability between the single-family and condo markets.
In the Twin Cities region, for the week ending October 13:
- New Listings increased 7.3% to 1,252
- Pending Sales increased 26.7% to 954
- Inventory decreased 28.8% to 16,017
For the month of September:
- Median Sales Price increased 12.6% to $174,500
- Days on Market decreased 28.4% to 101
- Percent of Original List Price Received increased 4.0% to 94.8%
- Months Supply of Inventory decreased 39.6% to 4.1
In between days. The spring and summer selling seasons are well behind us, and the holiday slowdown is well ahead of us (except in some department stores). As the days grow shorter, housing numbers may not be as thrilling as they were in recent months, but the trends remain the same. Compared to last year, sales are regularly up and inventory figures are down, including months of supply. Sales and prices will surely drop, but there is reason for optimism through the end of the year, providing a cure to several years of little to hold on to.
In the Twin Cities region, for the week ending October 6:
- New Listings increased 2.8% to 1,301
- Pending Sales increased 33.5% to 1,049
- Inventory decreased 28.6% to 16,113
For the month of September:
- Median Sales Price increased 12.6% to $174,500
- Days on Market decreased 28.5% to 101
- Percent of Original List Price Received increased 4.0% to 94.8%
- Months Supply of Inventory decreased 40.1% to 4.0
Some say that housing and the economy are woven together into a single garment of destiny. Let’s review recent national economic data: a good September non-farm payroll report marking 31 consecutive months of private job growth, the unemployment rate falling to 7.8 percent (a 44-month low), a widely positive S&P/Case-Shiller home price report and mortgage rates averaging close to 3.4 percent. Combine the above trends with less housing supply and strong home sales numbers, and you can start to see just what’s driving this recovery. Here’s what transpired locally.
In the Twin Cities region, for the week ending September 29:
- New Listings increased 6.2% to 1,314
- Pending Sales increased 15.5% to 1,000
- Inventory decreased 29.6% to 16,261
For the month of September:
- Median Sales Price increased 12.3% to $174,000
- Days on Market decreased 28.7% to 101
- Percent of Original List Price Received increased 4.1% to 94.8%
- Months Supply of Inventory decreased 40.9% to 4.0
