Author Archives: Mighty Agent
Weekly Market Report
 For Week Ending February 10, 2024
Seller profits declined for the first time since 2011, according to ATTOM’s Year-End 2023 U.S. Home Sales Report, which found that home sellers made a $121,000 profit on the sale of a median-priced single-family home in 2023, resulting in a 56.5% return on investment year-over-year. This is a slight drop from 2022, when home sellers made $122,600 on the sale of a typical single-family home, for a 59.8% return on investment. Despite the decline, however, seller profits and profit margins remained near record levels last year.
IN THE TWIN CITIES REGION, FOR THE WEEK ENDING FEBRUARY 10:
- New Listings increased 18.4% to 1,061
- Pending Sales increased 6.1% to 760
- Inventory increased 3.5% to 6,355
FOR THE MONTH OF JANUARY:
- Median Sales Price increased 3.2% to $353,035
- Days on Market decreased 8.2% to 56
- Percent of Original List Price Received increased 0.7% to 96.7%
- Months Supply of Homes For Sale increased 21.4% to 1.7
All comparisons are to 2023
Click here for the full Weekly Market Activity Report. From MAAR Market Data News.
January Housing Market Report
Year off to promising start with gains in listings and sales
- The median sales price increased 2.3% to $350,000
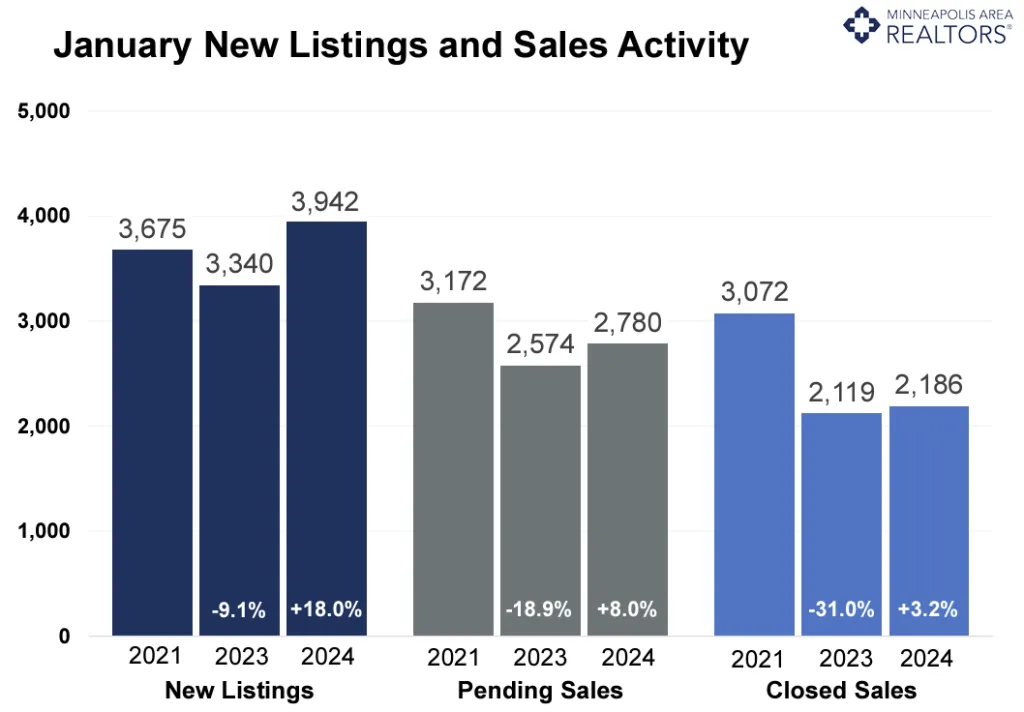
- Signed purchase agreements rose 8.0%; new listings up 18.0%
- Market times fell 8.2% to 56 days; inventory up 1.7% to 6,288
(Feb. 15, 2024) – According to new data from Minneapolis Area REALTORS® and the Saint Paul Area Association of REALTORS®, both buyer and seller activity rose in January. Sales rose from low levels as mortgage rates softened making sellers more confident about listing their homes.
Sellers, Buyers and Housing Supply
Sellers listed 18.0% more homes than last January. That marked a third consecutive month of year-over-year gains in new listings. Sellers are more optimistic about listing their homes and about getting stronger offers. They’re also feeling better about their payments on the next house. On the demand side, pending sales rose 8.0%, suggesting demand could be stabilizing. That second consecutive gain in signed contracts again was helped by lower rates but also reflects a low baseline period. Three consecutive monthly increases in listings and two consecutive monthly sales gains aren’t enough to lift activity levels back to where they were before mortgage rates rose.
The number of active listings statewide stood at 6,288, or 1.7% more than last January. Aspiring buyers planning on shopping during spring market should expect more competition from pent-up demand and will also face stubbornly low inventory levels. Monthly mortgage payments are of top concern when it comes to household budgets. The increase in mortgage rates combined with higher prices has pushed the monthly payment on the typical home up to $2,700 compared to around $1,800 in 2021. Sellers accepted offers at about 96.7% of list price compared to 96.0% flat last January. “While too early to say for sure, we might look back at December and January as a turning point,” said Jamar Hardy, President of Minneapolis Area REALTORS®. “The easing of rates combined with an increase in listings and inventory should mean somewhat smoother sailing for buyers.”
Prices, Market Times and Negotiations
Supply levels are too low for prices to fall but rates are too high for prices to rise much. The median sales price was up 2.3% to $350,000, which amounted to $199 per square foot. Homes lingered on the market for an average of 56 days, which is actually 8.2% faster than last year. In that time, sellers accepted offers at 96.7% of their asking price, which was up from 2023 but down from 2022. “The market activity is rising from the lows of 2023 and the mood is definitely different,” said Amy Peterson, President of the Saint Paul Area Association of REALTORS®. “As we head further into the spring market, the numbers show it’s still a seller’s market in most areas of the Twin Cities and buyers can position themselves for success by being ready to make a strong offer.”
Affordability, Rates and Payments
The Federal Reserve paused the rate hikes, but the impact of higher mortgage rates on monthly payments is hard to ignore. Mortgage rates hit a 23-year high in October 2023 but have retreated since. Recent data suggests the Federal Reserve may not be as willing to start cutting rates in March. The Housing Affordability Index reached its lowest level for January since at least 2004. Affordability is now at roughly 2006 levels. Using some assumptions around taxes and insurance, the monthly payment on the median priced home stood at $2,680 in 2023 compared to $1,760 in 2021. That additional cost can impact savings rates and discretionary spending in the economy.
Location & Property Type
Market activity always varies by area, price point and property type. New home sales rose at ten times the rate of existing home sales. Townhome sales rose at twice the rate as single family homes. Cities such as Medina, Monticello, New Prague and Rogers saw among the largest sales gains while Oak Grove, New Hope, Maplewood and Belle Plaine all had notably weaker demand.
January 2024 Housing Takeaways (compared to a year ago)
- Sellers listed 3,942 properties on the market, an 18.0% increase from last January
- Buyers signed 2,780 purchase agreements, up 8.0% (2,186 closed sales, up 3.2%)
- Inventory levels rose 1.7% to 6,288 units
- Month’s Supply of Inventory rose 21.4% to 1.7 months (4-6 months is balanced)
- The Median Sales Price was up 2.3 percent to $350,000
- Days on Market was down 8.2% to 56 days, on average (median of 39 days, down 9.3%)
- Changes in Pending Sales activity varied by market segment
- Single family sales rose 7.5%; condo sales were down 8.9%; townhouse sales were up 14.9%
- Traditional sales increased 7.6%; foreclosure sales rose 22.6% to 38; short sales were up 250.0% to 14
- Previously owned sales were up 3.3%; new construction sales increased 33.8%
- Sales under $500,000 rose 6.3%; sales over $500,000 were up 14.6%
Weekly Market Report
For Week Ending February 3, 2024
U.S. single-family rent growth was up 2.7% year-over-year as of last measure, according to Corelogic’s January 2024 U.S. Single-Family Rent Index, keeping in line with the annual rate of growth recorded prior to the pandemic. Attached singlefamily rents increased 3.3% year-over-year, while detached single-family rents rose 2.3%. Nationally, rent growth was highest in the lower-priced rental tiers, climbing 2.9% year-over-year.
IN THE TWIN CITIES REGION, FOR THE WEEK ENDING FEBRUARY 3:
- New Listings increased 17.9% to 942
- Pending Sales increased 4.2% to 720
- Inventory increased 2.6% to 6,446
FOR THE MONTH OF DECEMBER:
- Median Sales Price increased increased 1.4% to $353,900
- Days on Market increased 2.0% to 51
- Percent of Original List Price Received increased 0.4% to 96.7%
- Months Supply of Homes For Sale increased 20.0% to 1.8
All comparisons are to 2023
Click here for the full Weekly Market Activity Report. From MAAR Market Data News.
Weekly Market Report
For Week Ending January 27, 2024
Builder confidence continues to rise amid declining mortgage rates, climbing seven points to 44 in January, according to the National Association of Home Builders (NAHB)/Wells Fargo Housing Market Index (HMI). The latest reading marks the highest level of confidence since last summer, with builder sentiment up nine points from the same period last year. Mortgage rates have plunged more than one full percentage point since their peak of 7.79% in October, improving affordability and helping to bring some buyers back from the sidelines.
IN THE TWIN CITIES REGION, FOR THE WEEK ENDING JANUARY 27:
- New Listings increased 13.7% to 847
- Pending Sales increased 6.3% to 724
- Inventory increased 0.5% to 6,486
FOR THE MONTH OF DECEMBER:
- Median Sales Price increased 1.3% to $353,500
- Days on Market remained flat at 50
- Percent of Original List Price Received increased 0.4% to 96.7%
- Months Supply of Homes For Sale increased 20.0% to 1.8
All comparisons are to 2023
Click here for the full Weekly Market Activity Report. From MAAR Market Data News.
2023 Annual Twin Cities Housing Market Report
In 2023, higher interest rates continued to weigh on market activity, yet prices are still up
23-year high mortgage rates and rising prices increased monthly housing costs and slowed buyer activity
23-year high mortgage rates and rising prices increased monthly housing costs and slowed buyer activity
Minneapolis–Saint Paul, Minnesota (January 29, 2024) – After sales reached a 20-year high in 2021, sales in 2023 plunged to their lowest level since 2011. The pendulum always overswings. That decline can mostly be tied to higher interest rates along with rising prices and a shortage of housing supply. Mortgage rates rose nearly three-fold between 2021 and 2023—from 2.7% to 8.0%, and yet our region still saw record sales prices, although the pace of those gains has slowed.
2023: A Year in Review
Home sales fell for a second year in a row, according to an annual report issued by Minneapolis Area REALTORS® and the St. Paul Area Association of REALTORS®. Would-be buyers have been discouraged by a triple punch of higher mortgage rates, rising prices and low inventory. Yet, even weaker demand wasn’t enough to pressure prices lower because of the lack of available homes for sale. That meant sellers still saw reasonable offers relatively quickly—but not to the same degree as in 2021 and 2022. Aside from sales volume, in some ways, 2023 represented a return to a more normal, pre-COVID market.
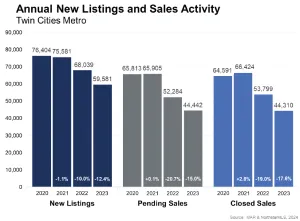
- New listings were down 12.4% while pending sales were down 15.0%.
- The median price rose 1.4% while homes spent 29.0% more time on the market.
- Sales under $500,000 were down 17.0% for the year compared to a 4.0% decline for luxury homes over $1 million.
- Single family purchase agreements declined 17.2% while townhomes fell 6.2%.
- Signed contracts on new homes were up 11.3% while they were down 17.7% for existing homes.
- While newly constructed home inventory rose slightly, builders simply can’t produce enough supply—nor at the right price points—to offset the affordability and supply challenges. Builders do, however, have every incentive to sell their homes and are offering innovative ways to help buyers while existing homeowners are more reluctant to sell and trade up.
While multiple offer situations are still happening but have become less common, waiving inspections and similar tactics have become rarer. Overall, buyers were more cautious and selective throughout the year. Sellers, however, felt the “lock-in” effect where they were reluctant to relinquish their favorable mortgage rates and trade up for a higher rate on a higher priced home. And, as we know, most sellers have to turn right around and be buyers, which partly explains why the largest share of buyers since 2013 chose to leverage their equity from their last home and purchase the next in cash as opposed to contending with higher mortgage rates.
“During the year, we saw many similar trends from the second half of 2022 where higher rates began to weigh heavier on the marketplace,” said Amy Peterson, President of the Saint Paul Area Association of REALTORS®. “We saw fewer listings and fewer sales; and yet higher prices, surprisingly strong offers and relatively quick market times.”
Rate Hikes and Short Supply
The rate hikes meant less activity, but the supply shortage meant decent offers, rising prices and homes selling in a reasonable time frame—albeit longer than the previous two years. Mortgage rates are too high for prices to rise significantly, but supply is too tight for prices to fall. There’s less activity overall but the balance between that buyer and seller activity remains tight. There will always be job, family or health changes that necessitate a home sale or purchase. That’s still happening, but some buyers who wanted to move at a 3.0 or 4.0% rate but don’t have to are choosing to stay put. The Federal Reserve has signaled there’s a good chance rates come down in 2024 in response to inflation cooling, but no guarantees. It would be a welcomed reprieve for frustrated buyers.
“Given the ever-changing nature of real estate, patience, persistence, creativity around financing, and managing expectations are key ingredients to a successful transaction,” said Jamar Hardy, President of Minneapolis Area REALTORS®. “If rates do come down, a lot of pent-up demand that’s been sidelined recently will be unleashed which could lead to another frenzied market with listings selling for over asking price. Whatever happens, it’s critical to work with a qualified market expert to navigate these complexities.”
Impact of Higher Mortgage Rates
Ultimately, residential real estate mostly boils down to monthly payments. That’s where affordability comes in. Relatively few homebuyers pay cash; most take out a mortgage with monthly payments. In that sense, monthly payments matter more than price. In fact, if you downsized to a less costly home last year there’s a chance your payments still rose. Enough well-paying jobs are key to sustaining the monthly payments, upkeep of and demand for homes. That’s why in the short term, rates matter. But in the long run, it’s the economy and labor market that determine the long-term health and sustainability of the housing market.
Since 2020, the typical payment on the median priced home has risen from around $1,600 per month to $2,700 per month. Even as income growth has accelerated over the last few years, that jump is too large a hurdle for too many Minnesotans. Committing a larger share of a household budget to housing also means less discretionary spending elsewhere in the economy, which is a key contributor to economic and job growth. Housing affects the economy, and the economy affects housing.
The impact of higher rates has rippled throughout virtually every corner of the marketplace. Compared to 2022, homes are taking longer to sell (40 vs. 31 days), sellers are accepting less of their asking price (99.3% vs. 100.9%) and absorption rates have risen (1.9 months vs. 1.5). But because the last several years were so unique, it’s worth comparing 2023 to 2019. When compared to 2019, home sales in 2023 were down 26.0% and new listings shrank 21.8%. While market times were up compared to 2022, homes sold more quickly than in 2019 and 2020. Although sellers received on average 99.3% of their list price for the year, they accepted 96.6% in December.
Market Activity by Region
“The [Twin] Cities are wonderful, but we also have an entire state that offers all sorts of different homeownership opportunities,” according to Geri Theis, President of Minnesota Realtors®. “Greater Minnesota offers something for everyone. But too many felt excluded from homeownership due to affordability challenges and we must continue working to change that.” Rural broadband, affordable childcare, education and a labor shortage remain thorny obstacles. “While it was undeniably a challenging year for buyers, over 60,000 Minnesotans were able to close on a home across our great state,” Theis continued.
Market activity always varies by geography, price point and market segment. For example, a large $600,000 single family home in Eden Prairie doesn’t affect a Duluth condo selling for $195,000 or a Brainerd cabin selling for $350,000. And with the rise of remote work, many Minnesotans can telecommute from outside the metro and reside on a lake in a more rural area, for example.
December pending sales—a measure of future demand—rose 8.7% statewide compared to a 3.7% increase in the metro. Home prices rose 3.3% for the month statewide versus 1.1% in just the Twin Cities. Both the metro and the state have below average unemployment rates and above average incomes. Challenges persist, but Minnesota seems well positioned. As inflation continues to cool and the economy remains stable, the rate environment should ease. That could incentivize more demand that would still be faced with a shortage of supply. It should make for an interesting year.
2023 by the Numbers | Compared to 2022
-
- Sellers listed 59,581 properties on the market, a 12.4% decrease from 2022
- Buyers closed on 44,310 properties, down 17.6%
- The Median Sales Price rose 1.4% to $368,000
- Inventory levels fell 4.9% to 6,270 units as of year-end
- Months’ Supply of Inventory was up 26.7% to 1.9 months of supply (5-6 months is balanced)
- Days on Market increased 29.0% to 40 days, on average (median of 18, up 28.6%)
- Changes in Sales activity varied by market segment
- Single family sales were down 20.0%; condos fell 12.8%; townhomes decreased 9.1%
- Previously owned sales declined 19.2%; new construction sales fell 3.9%
- $1M+ luxury sales shrank 8.0% but remain near record highs (up 19.3% in December)
Weekly Market Report
For Week Ending January 20, 2024
There were 4.9% more homes for sale on the typical day in December compared to the same period in 2022, according to Realtor.com’s December 2023 Monthly Housing Market Trends Report, marking the second consecutive month of annual inventory growth. The number of newly listed homes was also up, rising 9.1% annually, while the total number of unsold homes, including pending listings, was up 3.6% compared to last year.
IN THE TWIN CITIES REGION, FOR THE WEEK ENDING JANUARY 20:
- New Listings increased 13.8% to 823
- Pending Sales decreased 4.9% to 619
- Inventory decreased 2.3% to 6,478
FOR THE MONTH OF DECEMBER:
- Median Sales Price increased 1.3% to $353,700
- Days on Market remained flat at 50
- Percent of Original List Price Received increased 0.4% to 96.7%
- Months Supply of Homes For Sale increased 13.3% to 1.7
All comparisons are to 2023
Click here for the full Weekly Market Activity Report. From MAAR Market Data News.
December Monthly Skinny Video
Weekly Market Report
For Week Ending January 13, 2024
Fannie Mae’s Home Purchase Sentiment Index (HPSI) climbed nearly three points to 67.2 in December and was up 6.2 points year-over-year, according to the latest National Housing Survey®. The rise was attributed to increasing consumer optimism about mortgage rates, with a survey-high 31% of respondents indicating they expect mortgage rates will decline over the next 12 months. Homeowners, in particular, had greater optimism about the future of mortgage rates than renters, which could encourage some would-be sellers to list their homes this year, helping to increase the supply of existing homes for sale.
IN THE TWIN CITIES REGION, FOR THE WEEK ENDING JANUARY 13:
- New Listings increased 14.5% to 900
- Pending Sales increased 2.6% to 560
- Inventory decreased 4.2% to 6,397
FOR THE MONTH OF DECEMBER:
- Median Sales Price increased 1.3% to $353,700
- Days on Market remained flat at 50
- Percent of Original List Price Received increased 0.4% to 96.7%
- Months Supply of Homes For Sale increased 13.3% to 1.7
All comparisons are to 2023
Click here for the full Weekly Market Activity Report. From MAAR Market Data News.
Weekly Market Report
For Week Ending January 6, 2024
Median priced single-family homes and condos were less affordable compared to historical averages in 99% of counties nationwide in the 4th quarter of 2023, according to ATTOM’s Q4 2023 U.S. Home Affordability Report. Major homeownership expenses currently take up 33.7% of the average national wage, a slight improvement from the third quarter, when major expenses consumed 35% of the average national wage. ATTOM reports homeowners need an annual income of more than $75,000 to afford a home in approximately 57% of the county markets in the report.
IN THE TWIN CITIES REGION, FOR THE WEEK ENDING JANUARY 6:
- New Listings increased 3.9% to 853
- Pending Sales increased 19.3% to 476
- Inventory decreased 2.7% to 6,382
FOR THE MONTH OF NOVEMBER:
- Median Sales Price increased 2.2% to $362,550
- Days on Market remained flat at 40
- Percent of Original List Price Received increased 0.2% to 97.4%
- Months Supply of Homes For Sale increased 15.8% to 2.2
All comparisons are to 2023
Click here for the full Weekly Market Activity Report. From MAAR Market Data News.